
4. Dye structure analysis—Interpretation of data
4.1 HPLC Retention times
Dye analysis is always done using reversed-phase columns, but because there are so many manufacturers of columns and because analysts use so many different gradients, it is impossible to generalize much about retention times, except to say that the most polar compounds (usually glycosides) are eluted earlier than non-polar compounds (aglycones).
4.2 Electronic spectra
With most diode array detectors it is possible to monitor at several wavelengths simultaneously, for example 254 nm (all dyes and other aromatic organic compounds), 350 nm (yellow dyes), 450 nm (red dyes) and 600 nm (blue dyes). The following are some typical dye types and the wavelength ranges of peak maxima (λmax values). (Table 4.1)
Table 4.1. Approximate λmax values for classes of dyes
| λmax | Dye or compound type |
|---|---|
| 315-240 nm | Uncolored substances (mostly non-flavonoids) |
| ~348 nm | Flavones and flavone glycosides (also kaempferol glycosides) |
| 352 ±2 nm | Flavonol glycosides |
| 370 ± 4 nm | Flavonol aglycones |
| 380-390 nm | Chalcones |
| >390 nm | Aurones (e.g., sulfuretin) |
| ~346 + ~428 nm | Protoberberines (two well-separated peaks) |
| 415-435 nm | Anthraquinones (including alizarin) |
| ~440 + ~458 nm | Carotinoids (unresolved doublets) |
| ~480+~510 nm with shoulder | 1,4-dihydroxyanthraquinones (e.g., purpurin, carminic acid and other insect red dyes) |
| ~560 nm | Indirubin |
| ~610 nm | Indigotin |
4.3 Mass spectral data
4.3.1 Generalizations. Usually if a dye component has a mass >400 Da, it is a glycoside. Natural dye molecules contain either no or (rarely) an even number of nitrogen atoms (e.g., as in the indigoids) and have an even molecular mass (or molecular weight), so if one encounters a mass with molecular mass having an odd number, it is either a synthetic dye or something very unusual.
Mass spectral data are collected either in the negative ion or the positive ion mode, both of which give odd numbered values. Since most dyes are phenols, the negative ion mode usually gives the largest parent ion [M-1]- and simplest overall spectrum. The positive ion mode also gives molecular ions [M+1]+ and is particularly useful if one wants to analyze fragments (e.g., loss of glycosides).
4.3.2 Some commonly seen mass differences (Δm) and examples (Table 4.2)
| Δm | Examples |
|---|---|
| 2 Da | Hydrogenation of a C=C or C=O; opening of a ring structure |
| 14 Da | CH2 (OHOCH3, COOHCOOCH3); CH2OHCOOH |
| 16 Da | O |
| 30 Da | CH2O (HOCH3, pentosehexose) |
| 44 Da | Loss of CO2 (pseudopurpurinpurpurin) |
| 80 Da | SO3 (OHOSO3H) |
| 132 Da | Pentose (xylose, usually) |
| 146 Da | Deoxyhexose (rhamnose) |
| 162 Da | Hexose (glucose, usually; galactose) |
| 176 Da | Hexuronic acid (glucuronic acid) |
| 286 Da | Luteolin, kaempferol |
| 302 Da | Quercetin (also ellagic acid) |
| 316 Da | Isorhamnetin, rhamnetin |
4.4 Analysis and structures of flavonoid dyes
Although over 8000 flavonoids are known [Ø.M. Andersen, K.R. Markham (Eds.), Flavonoids: Chemistry, Biochemistry and Applications , Taylor & Francis, New York, 2006], the vast majority of them are flavones and flavonols (3-hydroxyflavones), primarily the glycosides of the flavones (luteolin, apigenin and chryseriol) and of the flavonols (quercetin, kaempferol and isorhamnetin) (Figure 4.1).
Many of the techniques for determining flavonoid structures have been described by Markham (K.R. Markham, Techniques of flavonoid identification . New York: Academic Press; 1982, p. 36-39). Unfortunately, in dye analysis, there is usually not enough material available for NMR analysis. Structure assignments here are based primarily on molecular mass and UV-Visible spectral characteristics, as well as on structures reported in the chemical literature. 3-O-Substituted flavonols such as quercetin and isorhamnetin generally absorb maximally at around 350-354 nm, with more highly O-substituted flavonols (e.g., myricetin) absorbing at somewhat higher values and less O-substituted flavonols (e.g., kaempferol) absorbing at lower values. The aglycones themselves absorb in the range of about 368-374 nm.

The retention times of flavonol glycosides are lower, due to their increased polarity, compared with the corresponding aglycones. Analysis of positive ion fragmentation patterns is very useful for determining the nature of sugar substituents on flavonols, although these mass spectral data generally do not reveal information about isomers (e.g., glucose vs. galactose, position of substitution on the flavonoid or whether the sugar is the α- or β-anomer). In some cases, information about the nature of the substituent can be obtained by measuring the rate of hydrolysis in acid (e.g., 1-2 M HCl at 50 ºC), with rates decreasing in the order sulfate>hexoside>>glucuronide; in addition, 3-O-glycosides (or sulfates) hydrolyze much faster than 7-O– or 4’-O-glycosides (see Markham, above).
4.4.1 Masses of Common flavonoid aglycones. Most flavonoid dye molecules increase in mass only by adding an oxygen atom (e.g., OH) or a methyl group, usually to an oxygen atom. Therefore, the mass increases in increments of 16 Da (for O) or 14 Da (for -CH2-). The chart below, starting with apigenin (M = 270 Da), shows the most common flavonoid masses seen in flavonoid dyes. The asterisks (*) indicate the most common sites of attachment of oxygen atoms. In general, a methyl group cannot be added unless there is an OH group to add it to, which is why the left side of the chart is truncated. Also, the OH at the 5-position (see Figure 4.1 above for numbering) cannot be substituted because it is needed for binding the mordant metal ion.
Actually, the number of aglycones seen in dyes is much smaller than indicated in Figure 4.2, as the bulk of dye molecules are derivatives of luteolin, kaempferol, quercetin and isorhamnetin (indicated by bold fonts). The list at the left indicates some of the common aglycones. Figure 4.3, Figure 4.4, Figure 4.5, Figure 4.6 and Figure 4.7 indicate the structures of some flavonoids found in dyes, as well as some related chalcones and aurones.

Flavonol

| R2’ | R3 | R3’ | R4' | R5' | R6 | R7' | Mass | Compounds | Aglycone abbr. |
|---|---|---|---|---|---|---|---|---|---|
| H | H | H | H | H | H | OH | 270 | Galangen | Gal |
| H | H | H | OH | H | H | OH | 286 | Kaempferol | Kae |
| OH | H | H | H | H | H | OH | 286 | *Datiscetin | |
| H | H | H | OCH3 | H | H | OH | 300 | Kaempferide | Kad |
| H | Glc | H | OH | H | H | OH | 448 | Kaempferol 3-O-glucoside (Astragalin) | |
| H | H | OH | OH | H | H | OH | 302 | Quercetin | Que |
| H | H | OH | OH | H | H | OH | 286 | 5-Deoxyquercetin (Fisetin) | Fis |
| OH | H | H | OH | H | H | OH | 302 | **Morin | |
| H | Glc | OH | OH | H | H | OH | 464 | Quercetin 3-O-glucoside (Isoquercitin) | |
| H | Gal | OH | OH | H | H | OH | 464 | Quercetin 3-O-galactoside (Hyperoside) | |
| H | Rha | OH | OH | H | H | OH | 448 | Quercetin 3-O-rhamnoside (Quercitrin) | |
| H | Glc-Rha | OH | OH | H | H | OH | 610 | Quercetin 3-O-rutinoside (Rutin) | |
| H | SO3H | OH | OH | H | H | OH | 382 | Quercetin 3-O-sulfate | |
| H | H | OCH3 | OH | H | H | OH | 316 | Isorhamnetin | Irh |
| H | H | OH | OCH3 | H | H | OH | 316 | Tamarixetin | Tam |
| H | Glc | OCH3 | OH | H | H | OH | 478 | Isorhamnetin 3-O-glucoside | |
| H | SO3H | OCH3 | OH | H | H | OH | 396 | Isorhamnetin 3-O-sulfate | |
| H | H | OH | OH | OH | H | OH | 318 | Myricetin | Myr |
| H | H | OCH3 | OH | OH | H | OH | 332 | Laricitrin | Lar |
| H | Glc | OCH3 | OH | OH | H | OH | 494 | Laricitrin 3-O-glucoside | |
| H | H | OH | OH | H | OH | OH | 318 | Quercetagenin | Qtg |
| H | H | OH | OH | H | OCH3 | OH | 332 | ***Patuletin | Pat |
| H | Glc | OH | OH | H | OCH3 | OH | 494 | Patuletin 3-O-glucoside | |
| H | H | OH | OH | H | H | OCH3 | 316 | Rhamnetin | Rhm |
| H | Glc | OH | OH | H | H | OCH3 | 478 | Rhamnetin 3-O-glucoside | |
| H | H | OCH3 | OH | H | H | OCH3 | 330 | Rhamnazin | Rhz |
| H | Glc | OCH3 | OH | H | H | OCH3 | 492 | Rhamnazin 3-O-glucoside | |
| H | CH3 | OCH3 | OH | H | OCH3 | OCH3 | 374 | Chrysoplenetin |
*ʎmax=346 nm, **ʎmax=354 nm, ***ʎmax=360 nm
Figure 4.3. Structures of some flavonols
Flavones

| R2’ | R3’ | R4' | R5' | R6 | R7 | Mass | Compounds | Abbr. |
|---|---|---|---|---|---|---|---|---|
| H | H | OH | H | H | OH | 270 | Apigenin | Api |
| H | H | OCH3 | H | H | OH | 284 | Acacetin | Aca |
| H | H | OH | H | C5H11 | OH | 338 | *8-Prenylapigenin | |
| H | OH | OH | H | H | OH | 286 | Luteolin | Lut |
| H | OH | OH | H | H | OGlc | 448 | Luteolin 7-O-glucoside | |
| H | OCH3 | OH | H | H | OH | 300 | Chrysoeriol | Chr |
| H | OH | OCH3 | H | H | OH | 300 | Diosmetin | Dio |
| H | OH | OH | H | H | OH | 314 | * +2 CH3 (Dimethylluteolin) | |
| OH | H | OH | H | C5H11 | OH | 354 | Artocarpesin | Art |
| H | OH | OH | OH | H | OH | 302 | Tricet | |
| H | OCH3 | OH | OH | H | OH | 316 | Selgin | |
| H | OH | OCH3 | OH | H | OH | 316 | ||
| H | OH | OH | H | OCH3 | OH | 316 | Eupafolin | Eup |
| H | OCH3 | OH | OCH3 | H | OH | 330 | Tricin |
* Found in M. tinctorius and A. hispidus
Figure 4.4. Structures of some flavones
C-Flavones
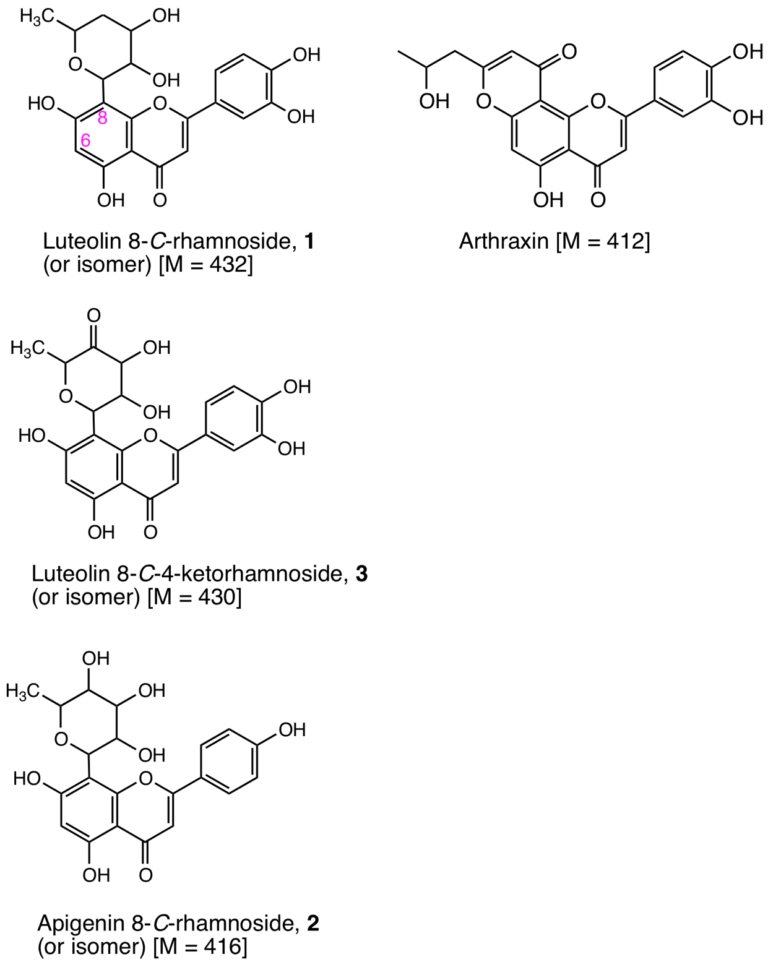
Figure 4.6. Structures of some C-flavones. All of these are found in extracts of Arthraxin hispidus and Miscanthus tinctoria.
Chalcones

| R4’ | R3’ | R2' | R3 | R4 | Mass | Compounds | Abbr. |
|---|---|---|---|---|---|---|---|
| OH | H | OH | H | OH | 256 | Isoliquiritigenin | Ilq |
| OH | H | OH | OH | OH | 272 | Butein | But |
| OH | H | OGlu | OH | OH | 434 | Coreopsin | Cor |
| OH | H | OGlu | OGlu | OH | 596 | Isobutrin | Ibu |
| OH | OH | OH | OH | OH | 288 | Okanin | Oka |
| OH | OH | OGlu | OH | OH | 450 | Marein | Mar |
| OH | OCH3 | OGlu | OH | OH | 464 | DiosmetLanceolinin | Lan |
| OH | OH | OGlu | OGlu | OH | 612 | Okanin diglucoside | OMG |
Figure 4.7. Structures of some chalcones
Aurones

| R3’ | R6 | R7 | Mass | Compounds |
|---|---|---|---|---|
| OH | OH | H | 270 | Sulfuretin |
| OGlu | OH | H | 432 | Sulfuretin 6-Glucoside |
| OGlu | OGlu | H | 594 | Sulfuretin 3’,6-Diglucoside |
| OH | OH | H | 286 | Marimetin |
| OH | OGlu | H | 448 | Maritimein |
| OH | OH | OCH3 | 300 | Leptosidin |
| OH | OGlu | OCH3 | 462 | Leptosidin 6-Glucoside |
Figure 4.8. Structures of some aurones
4.5 Analysis and structures of anthraquinone dyes
The large majority of red dyes are anthraquinones (see Figure 4.9 and Figure 4.10) and Singh et al. have catalogued some 68 anthraquinones from species of Rubia, which includes various species of madder (R. Singh, Geetanjali and S.M.S. Chauhan, “9,10-anthraquinones and other biologically active compounds from the genus Rubia,” Chem. Biodiversity, 1 1241-1264 (2004)). Like the flavonoids, the molecular masses of the anthraquinones—at least the ones having dyeing properties—differ in mass primarily by the number of OH (Δm = 16 Da) and methyl (Δm = 14 Da) groups.
In all the known species of madder used for dyeing, the primary colorant is purpurin, with the exception of Rubia tinctorum, which contains primarily alizarin, but also purpurin. Anthraquinone red dyes are also found in species of Galium (=Asperula), often used in northern Europe, and in Relbunium (=Galium), which were used in South America, but these species have not been carefully studied.
The structures shown in Figure 4.9 and Figure 4.10 are aglycones, but occasionally anthraquinone glycosides are seen. Most common of these are the primeverosides of alizarin (ruberythric acid) and lucidin, and glucosides of morindone (1,2,5-trihydroxy-6 methylanthraquinone). Glycosylation of the 2- or 4-hydroxy groups results in absorption at lower wavelengths and yellow or orange colors.Lorem ipsum dolor sit amet, at mei dolore tritani repudiandae. In his nemore temporibus consequuntur, vim ad prima vivendum consetetur. Viderer feugiat at pro, mea aperiam
Anthraquinones

| R2 | R3 | R4 | R6 | Mass | Compounds | Abbr. |
|---|---|---|---|---|---|---|
| OH | H | H | H | 240 | Alizarin | Ali |
| OH | H | OH | H | 256 | Purpurin | Pur |
| CH3 | OH | H | H | 254 | Rubiadin | Rub |
| CH3 | OH | H | OH | 270 | 6-hydroxyrubiadin | 6-HR |
| COOH | OH | H | H | 284 | Munjistin | Mun |
| COOH | OH | OH | H | 300 | Pseudopurpurin | PPu |
| CH2OH | OH | H | H | 270 | Lucidin | Luc |
| CHO | OH | H | H | 268 | Nordamnacanthol | Nor |
| H | OH | H | H | 240 | Xanthopurpurin | Xan |
| H | CH3 | H | H | 254 | Chrysophonol | Cry |
| H | CH3 | H | OH | 270 | Emodin | Emo |
| H | CH3 | H | OCH3 | 284 | Physcion | Phy |
| H | CH2OH | H | H | 270 | Aloe-emodin | Alo |
| H | COOH | H | H | 284 | Rhein | Rhe |
| H | COOH | H | OH | 300 | Emodic acid | Ema |
Figure 4.9.Structures of some anthraquinone aglycones. The compounds which are substituted on position 2 are found in species of Rubia, including madder. Those structures which have OH groups in positions 1 and 2 give red colors with an Al3+ mordant; compounds with the 1,4-dihydroxy structure (see also Figure 4.10 ) give the typical purpurin spectrum (λmax ~480 nm; shoulder ~510 nm). Those compounds which lack the hydroxy group at position 2 are generally found in the roots of species of Rumex and give yellow-orange colors.

Figure 4.10. Red dye compounds found in species of insects. All, except laccaic acid D (flavokermesic acid) have the 1,4-dihydroxy structure that gives the typical purpurin absorption spectrum, and a red color with Al3+ mordant.